Exploiting engineering data to build decision metrics (2/2)

Exploiting engineering data to build decision metrics (2/2)
In our previous blog post, we’ve discussed Cluster Analysis in detail. Cluster Analysis (or clustering) is a so-called unsupervised machine learning approach available to Optimus users to help them structure their engineering data sets. In this post, we’re digging deeper into another unsupervised machine learning technique available in Optimus, the Self-Organizing Maps (SOM).
Remember that unsupervised machine learning techniques don’t make any pre-assumptions related to the nature of the data or the potential relationships between data sets. These methods really take one step back, approaching the data points without prejudice and with the sole objective of building up knowledge.
Self-organizing maps deliver deeper understanding of the design space
A self-organizing map (SOM) is a type of artificial neural network that is trained using unsupervised learning techniques. Also this approach is not making any pre-assumptions related to the nature of the data or the potential relationships between data sets.
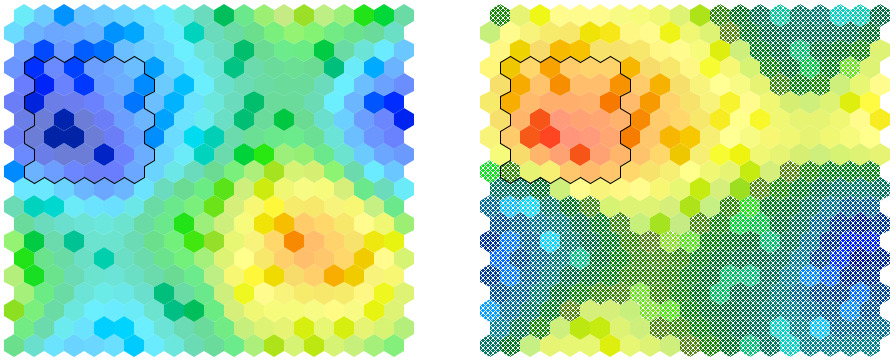
SOMs iteratively generated by Optimus are extremely useful in creating low-dimensional views (typically two-dimensional) on high-dimensional data. Each cell in such a SOM Plot represents a specific design space region coded with a color and a transparency level. The color represents the parameter value for which the SOM Plot is being generated, whereas transparency provides an indication about the number of (virtual) experiments the data are based on. As a result, similar SOM Plot patterns reveal similar parameter behavior and more transparent areas indicate low experiment density.
SOM Plot evaluations with Optimus can be effectively used for various purposes:
- Identify correlation between parameters
It’s possible to tell from the color patterns whether some input is always low when a certain output is high, etc. This may eventually lead to a reduction of input parameter dimensionality during a DOE or optimization process by fixing some input parameter(s) to a constant value.
- Find the most interesting regions within the design space
When minimizing a specific output, for example, it’s interesting to check which inputs result in a low output. Alternatively, a SOM Plot can be used to identify regions where output colors change significantly, revealing high sensitivity.

SOM plot showing negative correlation between design parameter (left) and system response (right) within the feasible part of the design space (hatched region documents infeasible design space, where design constraints are violated).
- Plan a better targeted DOE
A better targeted DOE, based on the previous information, can be planned to sample the design space within the most interesting regions. These samples append valuable information to the data set that’s already available. This is essentially an adaptive DOE with a human in the loop.
In the real world, SOM Plots effectively help better understand compressor blade damage
Compressor blades in jet engines can get damaged from a number of environmental sources (birds, volcanic ashes, etc.). This so-called Foreign Object Damage (FOD) ultimately reduces the aircraft lift force. Over twenty-six million blades are in use throughout the world and a great deal of time and money is spent repairing these blades. It’s imperative to determine the maximum damage the blades can have before requiring repair or replacement. This allows for maximizing aircraft safety and at the same time minimizing maintenance costs.

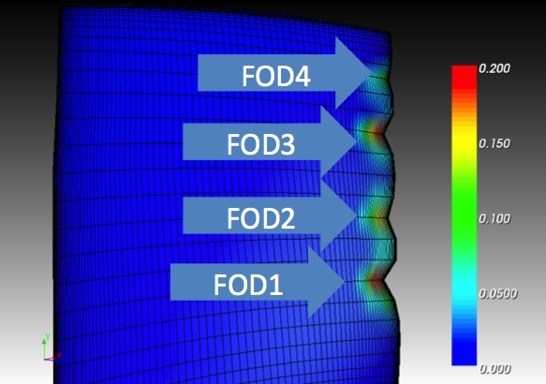
Based on an existing blade design, engineers created a deformation volume representing four nicks (blade indentations inflicted by foreign objects) distributed along the leading edge of the blade, each nick being described by 1 design parameter.
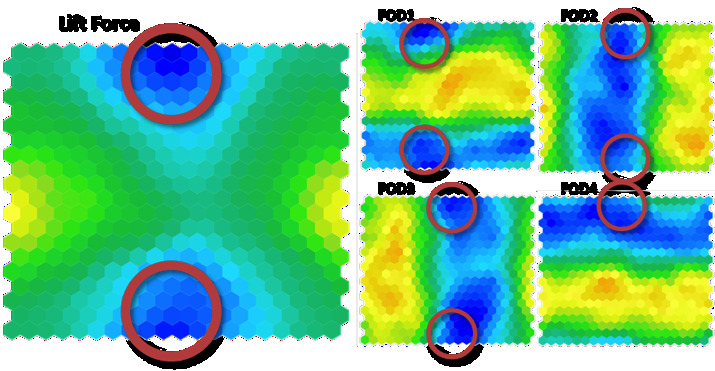
In a related project, SOM plots revealed the degree of correlation between all damage-related design parameters and the lift force. This provided a focus on the design parameters that seemed to be most highly correlated with the lift force, ultimately reducing the number of input parameters to be considered during the subsequent optimization process – saving valuable engineering time.

SOM plots revealed that design parameters FOD2 and FOD3 are most highly correlated with lift force.
For more details on this application, download the full PDF.
Lessons to be learned
Unsupervised machine learning techniques such as clustering and self-organizing maps provide Optimus users with strong capabilities to structure their engineering data. That allows them to derive valuable correlation information and gain a deeper understanding of the design space – without the need to make any pre-assumptions related to the nature of the data or the potential relationships between data sets.
An important aspect in this regard is the possibility to interactively visualize both the data and the analysis results. That makes it easy for engineers to interpret and exploit the available information, and to build actionable decision metrics. Unsupervised machine learning methods really help them build the information on which to base critical engineering decisions – empowering their experience to the maximum extent.
Tags
Other posts
-
What's new in Optimus 2025.1 — More Power, Control and Efficiency
May 19, 2025
-
Accelerate automotive crashworthiness with AI
May 13, 2025
-
R&D: The Centre of Innovation in Engineering
Apr 29, 2025
-
Bringing AI to Engineering Postprocessing: The Story Behind Optimus AI Postprocessing
Feb 26, 2025
-
Are siloed engineering teams draining your resources and slowing down innovation?
Feb 26, 2025
-
Are Engineers Ready to Fully Embrace AI Models in Design and Analysis?
Jan 27, 2025
©2025 Noesis Solutions • Use of this website is subject to our legal disclaimer
Cookie policy • Cookie Settings • Privacy Notice • Design & Development by Zenjoy