Exploiting engineering data to build decision metrics

Exploiting engineering data to build decision metrics
Engineers regularly get buried under massive amounts of data generated through simulation and physical testing. As a result they spend a lot of time and effort to access and identify the data that matter most – assuming they have sufficient time to exploit all the data and turn these into decision metrics.
Therefor manufacturers are looking for intuitive data mining solutions.
Let’s phrase this more accurately: they’re looking for engineering data discovery tools to acquire deeper engineering insights than possible today. While on the one hand manufacturers expect such tools to easily access large amounts of high-dimensional engineering data, these tools should on the other hand make it possible to extract design and engineering knowledge from the data.
Now this is precisely where Cluster Analysis and Self-Organizing Maps (SOM) come in. Both are unsupervised machine learning approaches that efficiently classify and structure the data in order to find a hidden structure in so-called unlabeled data. Such unsupervised machine learning techniques don’t make any pre-assumptions related to the nature of the data or the potential relationships between data sets. These methods really take one step back, approaching the data points without prejudice and with the sole objective of building up knowledge. This approach very often unlocks subtle or even non-intuitive aspects of the data, and allows visualizing the information on easy-to-interpret 2D graphics.
Cluster analysis structures engineering data sets
The first thing you probably expect from us is an explanation of what cluster analysis actually is. Well, let’s just do that. Cluster analysis (or clustering, in short) is the task of grouping data points such that points in the same cluster are more similar to each other than to points in other clusters. As such, clustering does not stand for any specific algorithm. It rather implies a collection of algorithms as a function of how the notion ‘similar’ is interpreted. Clustering is used in many fields (including machine learning, pattern recognition, image analysis, bioinformatics, etc.) for exploratory data mining and for statistical data analysis.
And how does this specifically relate to Optimus? With Optimus, engineers have access to a number of different clustering algorithms. Next to centroid-based clustering methods (‘k-means’ algorithms which aim to partition a set of n observations into a pre-defined k number of clusters) and hierarchical clustering methods (methods that seek to build a hierarchy of clusters based on the core idea of data points being more related to nearby data points than to more distant points), Optimus incorporates Gaussian Mixture Models (GMM) clustering methods.
Optimus sets itself apart by automatically calculating the appropriate number of clusters for the specific application under investigation. This is critical in obtaining an automated cluster analysis process that consistently delivers accurate results, yet lowering the threshold for the non-expert user.
As an engineer, you may be in for a nice surprise
By grouping design data points with similar characteristics in separate clusters, Optimus provides valuable insights into correlations between and within clusters. In addition, Optimus supports visualization tools for easy graphic cluster evaluation including cluster scatter and parallel coordinates charts.
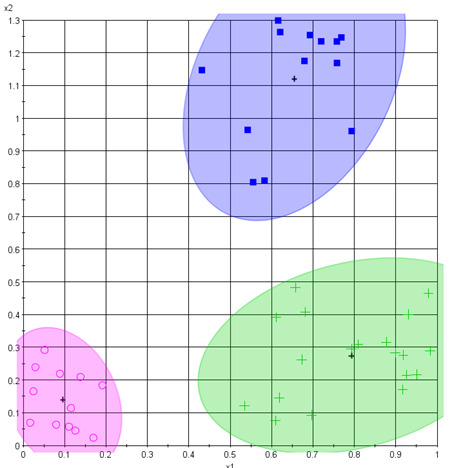
When looking at the cluster scatter chart below, the first thing that may come to your mind is: “Isn’t it obvious that the data is clustered in 3 groups?” Well, remember that you’re looking at a particular 2D visualization of the data points. Cluster analysis operates on the complete set of data points with their full dimensionality. That’s a much broader perspective than any human can possibly deal with by looking at a number of 2D charts to understand how data points interrelate. Therefor this approach is very likely to deliver results which were not expected beforehand.

Example of an Optimus cluster scatter chart
That is the main reason why cluster analysis is used. It helps engineers identify interesting regions in the design space and then drill these down into greater detail. Clustering may also trace correlations between designs within the same cluster, which would not necessarily be revealed by a global correlation analysis covering all designs.
Besides gaining deeper insights through smarter local data correlations, cluster analysis potentially saves tremendous simulation time. In specific situations, the data set can even be reliably reduced to individual cluster-representative data points instead of using all the data points that belong to the cluster.
In our next blog post, we’ll discuss self-organizing maps in more detail. When you don’t want to miss this post, simply subscribe to our blog. In case you want to learn more about clustering and self-organizing maps, feel free to watch our recent webinar recording.
Tags
Other posts
-
What's new in Optimus 2025.1 — More Power, Control and Efficiency
May 19, 2025
-
Accelerate automotive crashworthiness with AI
May 13, 2025
-
R&D: The Centre of Innovation in Engineering
Apr 29, 2025
-
Bringing AI to Engineering Postprocessing: The Story Behind Optimus AI Postprocessing
Feb 26, 2025
-
Are siloed engineering teams draining your resources and slowing down innovation?
Feb 26, 2025
-
Are Engineers Ready to Fully Embrace AI Models in Design and Analysis?
Jan 27, 2025
©2025 Noesis Solutions • Use of this website is subject to our legal disclaimer
Cookie policy • Cookie Settings • Privacy Notice • Design & Development by Zenjoy